VUL ASSESSMENT
Cyber Security
Risk-Based
SecOps Risk-Based Prioritization Methodology

Dinesh Choudhary
September 30, 2026


Managing vulnerabilities across a modern attack surface is difficult, and it is difficult for the same reason at every organization regardless of size: there is always more to fix than there are people and hours to fix it. Trying to address everything without a prioritization strategy is not thorough, it is wasteful. Resources go to low-risk issues while the vulnerabilities that attackers are actually using stay open.
Prioritization is the answer, but only if it is built on the right inputs. A severity score on its own does not tell you whether anyone is attacking a vulnerability, or whether the system it sits on matters to your business. Both of those things change the answer completely.
This article explains the methodology SecOps uses to turn raw vulnerability data into a ranked, defensible remediation order. It covers which signals go in, how they are combined, and why each design decision was made the way it was.
Prioritization used to be about working efficiently. At current disclosure rates it is about capacity, and the gap between what is published and what any team can fix is now very wide.
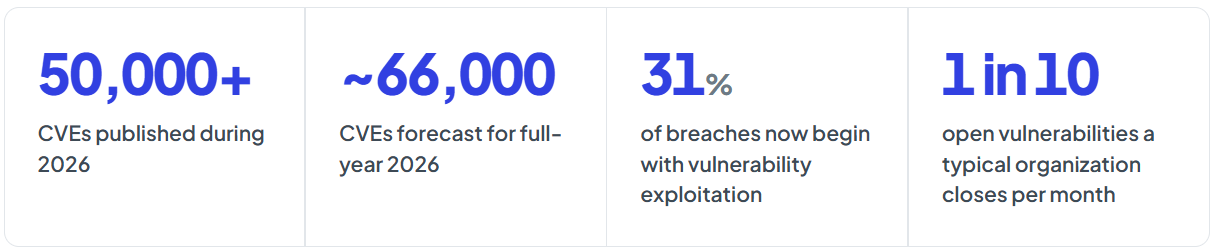
At its 2026 peak, disclosure reached nearly ten thousand CVEs in a single month, roughly one every six minutes. Remediation capacity has not grown to match. The 2026 Verizon Data Breach Investigations Report found median time to patch moving in the wrong direction, from 32 days to 43, which means teams are falling behind rather than catching up.
Three recent developments have made this harder still.
Exploitation increasingly precedes the patch. Google Threat Intelligence tracked 90 exploited zero-days during 2025, and 43 of them, a record share, targeted enterprise technology. They concentrated in exactly the places that are hardest to monitor: security appliances, networking infrastructure, VPNs and virtualization platforms, which offer privileged access and rarely support endpoint detection.
The National Vulnerability Database stopped scoring most vulnerabilities. Under a 2026 policy change, NIST enriches only CVEs that appear in CISA's Known Exploited Vulnerabilities catalog, affect federal government software, or are designated critical under Executive Order 14028. Everything else is tagged Lowest Priority, with no CVSS score, no product mapping and no weakness classification. Any pipeline that waits on the NVD now stalls on the large majority of CVEs.
Vulnerability discovery has begun to operate at machine scale. In 2026 Anthropic and approximately fifty partners used Claude Mythos Preview to identify more than ten thousand high or critical severity vulnerabilities across more than a thousand open-source projects and partner codebases, with a sampled subset validated by independent security firms. The number of vulnerabilities that can be found is no longer limited by how many researcher hours are available, and disclosure volumes should be expected to rise further.
Under these conditions prioritization stops being a way to work more efficiently and becomes the main lever a security team still controls.
The Common Vulnerability Scoring System gives the industry a shared vocabulary for how serious a vulnerability is, and it does that job well. Problems start when severity alone is used to decide what gets fixed first.
Of CVEs published in the first half of 2026 that carry a score, 10.0% are rated Critical and 39.1% High. A policy of fixing everything scored 7.0 and above therefore puts close to half of all published vulnerabilities into the queue, which leaves a team with very little narrowing to work with.
It is worth being precise about the limitation, because CVSS is often criticized for things it never claimed to do. CVSS v4.0 does include Threat and Environmental metric groups specifically so organizations can account for exploit maturity and their own environment, and the specification explicitly tells implementers to enrich scores with factors that sit outside CVSS entirely. The accurate statement is narrower:
CVSS measures the severity of a vulnerability. It does not measure the risk that vulnerability presents to a particular organization, and was not designed to.
That leaves an obvious question. If severity alone cannot decide what gets fixed first, what else belongs in the decision, and where does each part of it? Exploitation evidence is one piece, but it describes the vulnerability rather than your environment. Business importance and internet exposure describe the machine, not the flaw. Neither tells an executive whether the organization as a whole is getting safer or worse. These are three separate questions, and trying to answer all of them with a single number is what makes most scoring feel arbitrary.
SecOps scores risk at three levels, each answering a different question for a different audience. Every layer is built from the one below it, so a change in exploitation activity on a single CVE propagates all the way up to the organizational view.
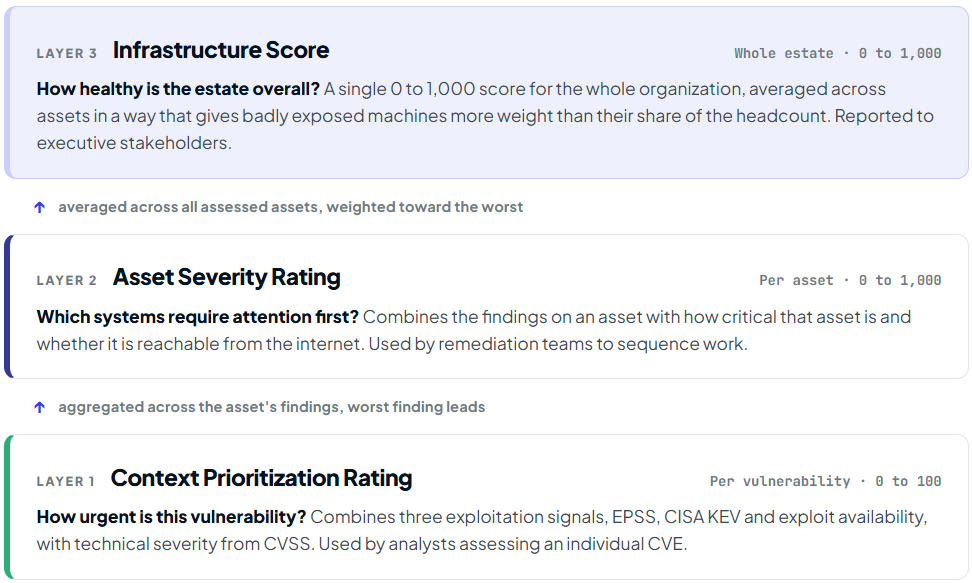
Keeping the layers separate is deliberate. A vulnerability score on its own cannot tell you what to fix first, because the same CVE carries very different risk on a domain controller than on a spare workstation. An asset score on its own cannot tell you whether the program is improving over time. And a single organization-wide number gives a remediation team nothing to act on. Each layer answers its own question, and none of them replaces the others.
Layer 1 draws on three kinds of data, and the difference between them shapes the whole model. They are not interchangeable, and averaging them together does not work.
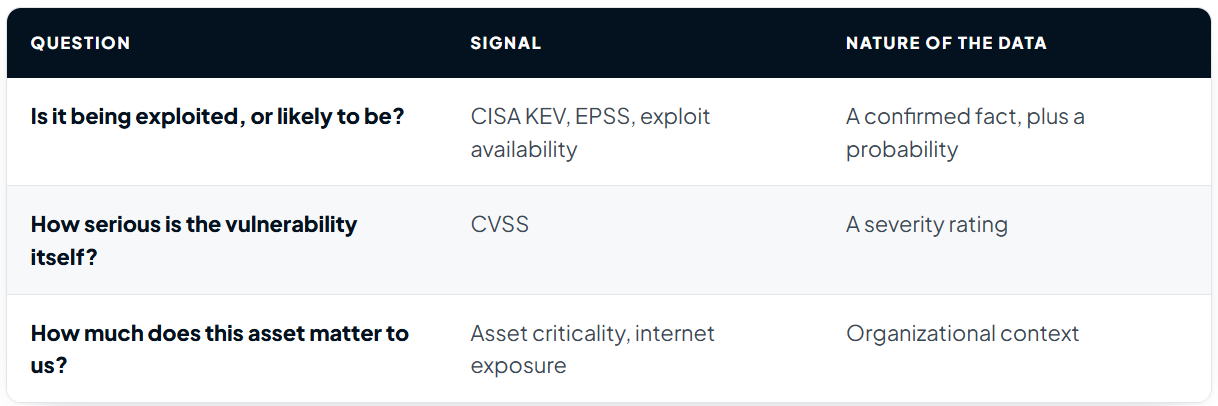
Each category behaves differently, so each is handled separately. A confirmed observation and a probability belong on the same axis, because both describe exploitation. A severity rating belongs on a separate axis, because it describes how serious the vulnerability is in itself rather than the chance of anyone using it. Business context belongs at the asset layer, where it multiplies rather than adds.
CISA KEV is the catalog of vulnerabilities confirmed to be exploited in the wild. Appearing in it is evidence rather than a prediction, which makes it the strongest single signal available.
EPSS, the Exploit Prediction Scoring System, estimates the probability that a vulnerability will be exploited within the next 30 days. It scores every published CVE daily, which gives a forward-looking reading even on vulnerabilities that have no exploitation history yet.
Public exploit availability is whether working attack code exists and how usable it is. A proof of concept published to a code repository, an entry in a public exploit database, and a ready-made module in an exploitation framework are all different points on that scale. Each one lowers the skill and effort needed to attack the vulnerability, which widens the set of attackers capable of using it.
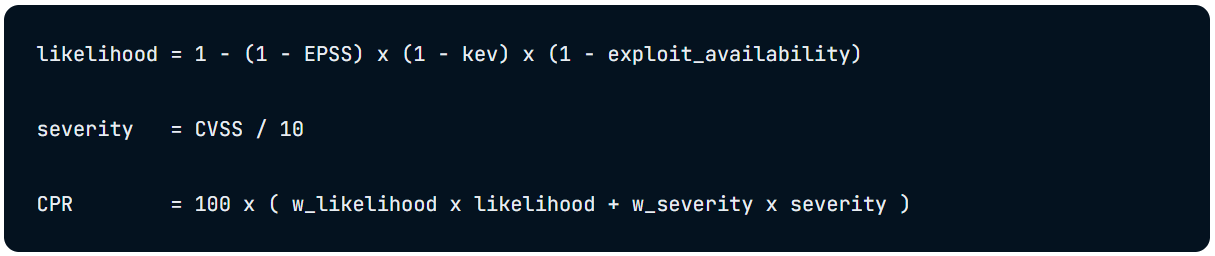
The Context Prioritization Rating, or CPR, is the per-vulnerability score, reported on a 0 to 100 scale. It answers two questions separately, then combines them.
Three indicators that a vulnerability will be attacked, each expressed as a value between 0 and 1.
EPSS is the modelled probability that a vulnerability will be exploited within the next 30 days, refreshed daily for every published CVE. It enters as its published value, unmodified.
CISA KEV contributes a fixed 0.70 when a vulnerability appears in the catalog. A listing is confirmed observation rather than prediction, which is why it carries the largest fixed weight in the model. The value is a policy decision about how much confirmed exploitation should count, not an estimate of probability.
Exploit availability asks whether working exploit code exists and how easy it is to use. This matters because it decides who is capable of running the attack. A vulnerability that requires original research is a very different proposition from one packaged inside an exploitation framework. It is graded on a single scale, taking the strongest evidence found:
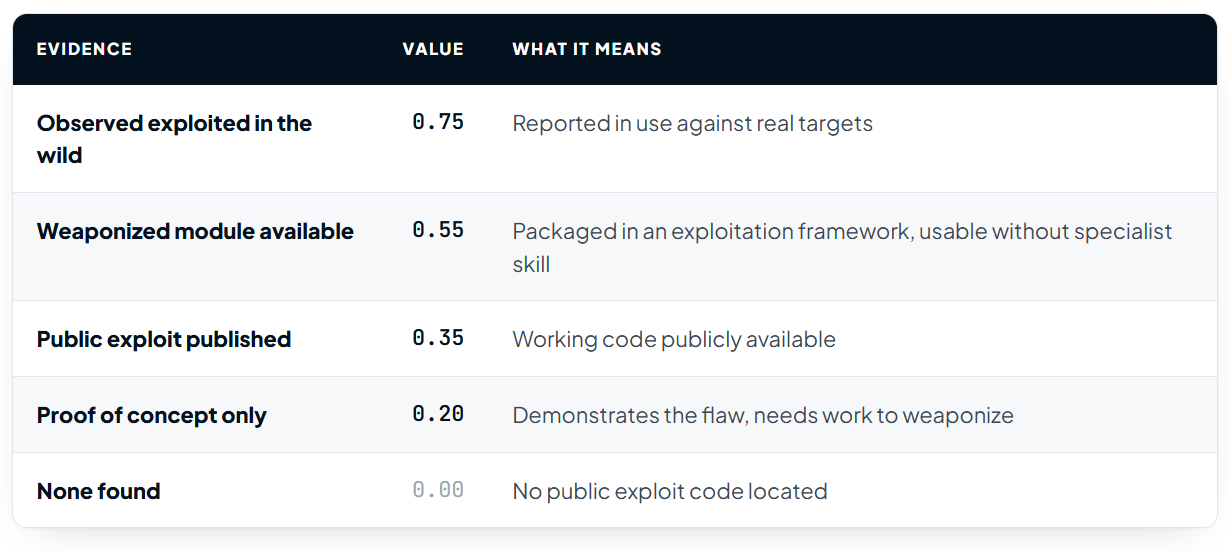
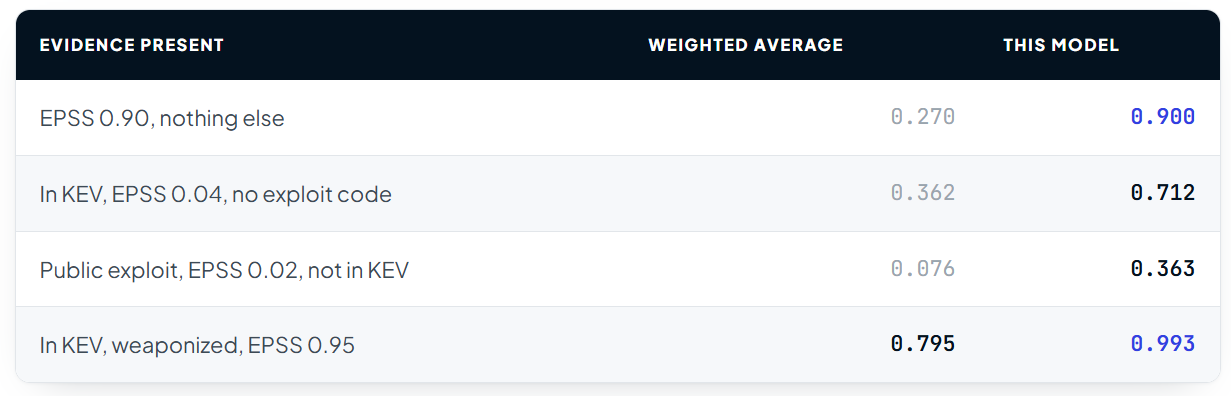
A weighted average, giving each signal a share of the total, has a limitation that matters here. Under a weighted average, no signal can contribute more than its own weight, so a vulnerability with an EPSS score of 0.90 and nothing else is capped at whatever share EPSS was given. A 90% chance of imminent exploitation would come out looking moderate. Changing the weights does not fix this, because the limitation is structural.
The signals are combined as independent indicators instead. Read the formula as the chance that at least one indicator is right. Each (1 - signal) is the chance that indicator is wrong, multiplying them gives the chance they are all wrong, and one minus that is the result.
Two useful properties follow. A single strong signal is enough on its own, so an EPSS score of 0.90 with nothing to back it up still produces a likelihood of exactly 0.90. And signals reinforce each other without the total ever passing 1, so a vulnerability that is in KEV, has a weaponized module available and scores 0.95 on EPSS comes out at 0.993.
CVSS, normalized to 0 to 1 by dividing by 10. It describes how serious the vulnerability is in itself: whether an attacker reaches code execution, what data is exposed, whether the system stays usable, and how much access or user interaction is needed to get there.
The name of this axis matters, because it is technical severity, not technical impact. A CVSS score combines an impact sub-score, built from confidentiality, integrity and availability, with an exploitability sub-score built from attack vector, complexity, privileges required and user interaction.
That overlap is accepted deliberately rather than engineered away. Using the isolated impact sub-score would remove it, but that sub-score takes only fifteen distinct values across the entire corpus, with more than eight vulnerabilities in ten landing on just three of them. It is far too coarse to rank a backlog by, and a scoring axis that cannot separate its own population is worse than one carrying a known, bounded overlap.
Because CVSS coverage is uneven, severity is sourced through a fallback chain rather than a single lookup. Where an NVD score exists it is used. Where it does not, the score published by the CNA is used, including CVSS 4.0 scores. A vulnerability with no score from any source is still ranked on its exploitation evidence, since after the NVD's 2026 policy change a missing score means the CVE fell outside NIST's enrichment criteria and says nothing at all about severity.
The likelihood and severity weights are the one part of the model an organization configures, and they must total 100. They express a real trade-off between how likely an attack is and how much damage it would do. The default leans toward likelihood, but a team working under a regime that emphasizes consequence can shift the balance and the score will follow.
Nothing else is exposed as a setting. How different kinds of exploitation evidence relate to each other is an empirical question rather than a matter of preference, and holding those values constant keeps scores comparable across organizations and over time.
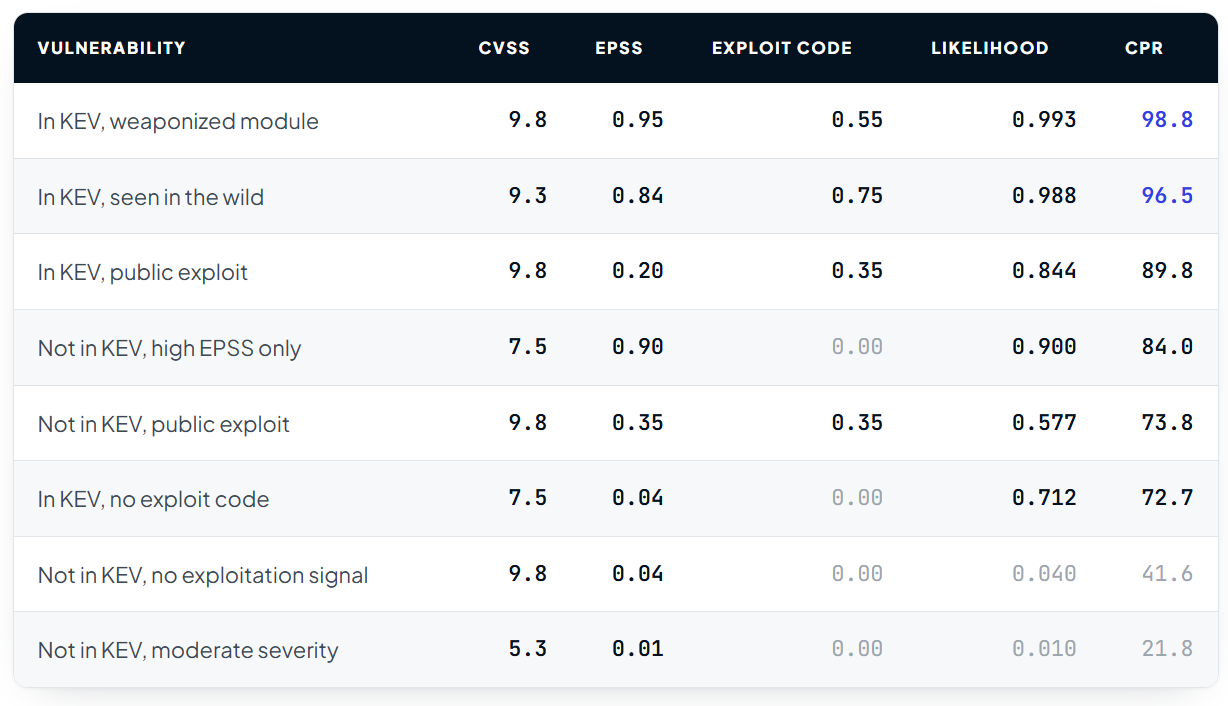
Rows six and seven make the central point. A CVSS 7.5 that is confirmed exploited scores 72.7, while a CVSS 9.8 with no exploitation signal scores 41.6. Ordering by severity alone would place them the other way round, and would do so consistently across the whole backlog.
Row four is worth noting too. A vulnerability that appears in no catalog and has no published exploit code still ranks high on the strength of its EPSS score alone. Fewer than one in four hundred CVEs reaches an EPSS of 0.90, so a score at that level deserves attention without needing anything to back it up.
CPR is continuous and works best as a ranking rather than a set of bands, but the separation it produces is stark. Confirmed-exploited vulnerabilities carry a median likelihood of about 0.94, while everything else sits near 0.01, and that gap survives into the final score.
As broad guidance: values above 70 indicate substantial exploitation evidence and a genuine time constraint. Values between 40 and 70 represent the range in which severity is significant but exploitation evidence is partial, and asset context should determine sequence. Values below 40 indicate vulnerabilities suitable for remediation within routine patch cycles.
The same vulnerability does not carry the same risk on every machine. Two context factors modify the score.
Asset criticality is a 1 to 5 rating of how essential a system is to business operations, revenue and reputation. It is set per asset and is the primary way organizational knowledge enters the model, because it is the one thing no external data feed can tell you. A payroll database and a lab VM can run identical software with identical vulnerabilities and represent completely different risk.
It enters the calculation as a multiplier running from 0.35 at the lowest rating to 1.00 at the highest, in even steps: 0.35 + 0.65 x (criticality - 1) / 4, giving 0.35, 0.51, 0.68, 0.84 and 1.00. A criticality 1 asset therefore carries a little over a third of the risk weight of a criticality 5 asset with the same findings. Because this factor is powerful, an uncurated estate where everything sits at the default will produce a flat and largely useless ranking. Setting criticality accurately is the highest-value configuration work in the platform.
The multiplier stops at 0.35 rather than running down to zero, and the floor is deliberate. Business importance scales the entire score, so a multiplier small enough will hold an asset below a band boundary no matter what is found on it. Without a floor, the lowest criticality rating would cap an asset in the Low band permanently, and a machine under active attack would be reported as low risk purely because someone had labelled it unimportant. The floor keeps criticality as comfortably the strongest context modifier in the model, while still allowing an actively exploited, internet-facing host to surface. That matters, because an attacker is perfectly happy to use a machine nobody values as the route to one they do.
Internet exposure distinguishes systems reachable from the public internet from those that are not, and is derived automatically from the asset's addressing rather than being entered by hand. This is not a minor refinement. The 2025 DBIR found edge devices and VPNs jumped from 3% to 22% of exploitation-driven breaches in a single year, an almost eightfold increase.
Exposure applies as a multiplier of 1.2 rather than as a fixed bonus, and the distinction matters. A bonus adds the same amount to every asset regardless of what else is true about it, so it barely moves a high-scoring asset and disproportionately inflates a low-scoring one. A multiplier scales with the risk already present, which is the behavior the model is designed for: internet exposure should make a dangerous vulnerability considerably more dangerous, and a harmless one only slightly less harmless. The value of 1.2 is a policy setting rather than a measured constant.
The Asset Severity Rating, or ASR, expresses the risk carried by a single asset on a 0 to 1,000 scale, with four bands: Low below 251, Medium to 500, High to 750, and Critical above.
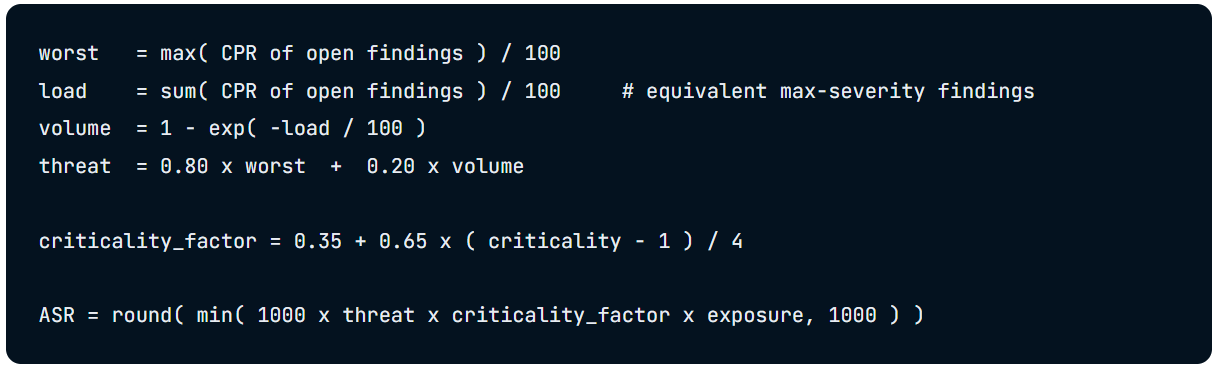
Three terms determine the result.
worst is the highest CPR among the asset's open findings, normalized back to 0 to 1. This is the dominant term, at 80% of the threat calculation. It reflects how a host actually gets compromised: an attacker needs one reliable way in, not fifty, and the easiest route onto the machine is what determines how exposed it is.
load restates the backlog as a count. Dividing the summed CPR by 100 gives the number of findings the asset would have if every one of them were at maximum severity, so an asset carrying two hundred routine findings and one carrying forty severe ones can be compared on the same footing.
volume turns that count into a 0 to 1 figure that rises quickly and then flattens. The constant sets where it flattens: 100 says that a backlog equivalent to a hundred maximum-severity findings is a full one. Accumulated findings are real risk and must always push the score up, but with diminishing returns, because the difference between one open finding and ten matters enormously and the difference between 1,400 and 1,500 does not.
Every additional finding raises the rating. It never lowers it, and it never leaves it unchanged, because asset risk is an absolute quantity rather than a per-finding average. This is the property that separates this layer from the organizational one.
threat weights these at 80% and 20% respectively, then criticality and exposure scale the result into the final 0 to 1,000 rating. Because backlog is capped at a fifth of the calculation, severity continues to win.
The four bands are Low below 251, Medium from 251 to 500, High from 501 to 750, and Critical above 750. In practice an asset reaches the upper bands only through a combination of business importance, which is what the weighting is intended to produce. A Critical rating indicates that a business-important asset carries a vulnerability under active exploitation. A Low rating on a criticality 5 asset indicates that the asset is currently well maintained, not that it is unimportant.
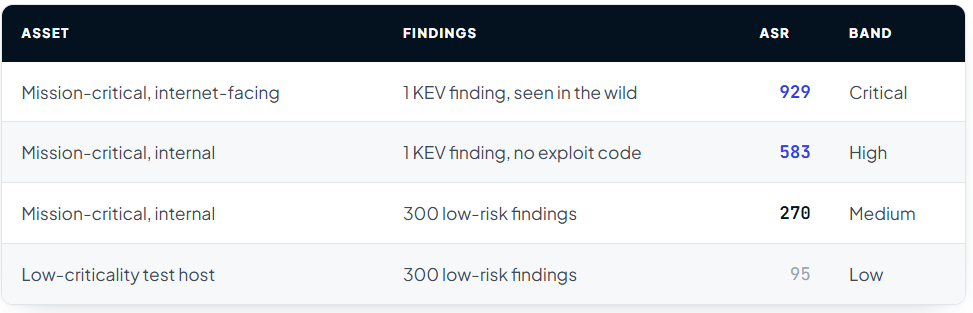
The final two rows demonstrate that volume continues to register. A neglected host carrying hundreds of open findings remains visible in the ranking; it simply does not outrank a business-critical system carrying a single vulnerability under active exploitation.
The Infrastructure Score is a single number on the same 0 to 1,000 scale as the Asset Severity Rating, describing the condition of the estate as a whole. It is the number for a board pack, a quarterly review, or a trend line.
It answers a different question from the layer below it, and the difference decides the shape of the formula. An asset score measures risk: every additional vulnerability on a machine makes that machine more dangerous, so the rating is absolute and only ever climbs. An organizational score measures health: acquiring more machines is not the same as acquiring more danger. A company that doubles in size without changing how well it patches has not doubled its problem. So where the asset layer sums, the organizational layer averages.
The difficulty is that a plain average is a poor description of an estate. Take the mean Asset Severity Rating across three thousand machines and a hundred badly exposed servers disappear into it, because ninety-seven percent of the population is quiet and the arithmetic treats every machine as equally informative. What is needed is an average in which worse machines count for more than their share of the headcount.

This is a cubic mean, and it sits deliberately between the two obvious choices. A plain arithmetic mean lets the quiet majority set the number. Taking the maximum lets a single machine set it. Cubing before averaging places each asset on the scale by the cube of its severity, so a machine at 900 counts for roughly seven hundred times one at 100 rather than nine times, and the result stays on the same 0 to 1,000 scale with the same four bands.
The methodology rests on a small number of commitments:
None of this removes the need to patch. It decides the order, and at disclosure volumes approaching 66,000 vulnerabilities a year against a remediation budget that is effectively fixed, the order is very nearly everything.
At SecOps Solution, we also incorporated the EPSS scoring system which will give security teams and business leaders the information they desperately need to make smart risk-based decisions. We developed an EPSS calculator which is a tool that allows users to search for any vulnerability where users can quickly assess the exploit probability of any vulnerability along with their severity, impact, exploit activities, and potential remediation steps on a single platform. This can be a valuable tool for IT and cybersecurity professionals who need to stay informed about any latest vulnerabilities.
SecOps Solution is an agent-less Risk-based Vulnerability Management Platform that helps organizations identify, prioritize and remediate securityvulnerabilities and misconfigurations in seconds.
To schedule a demo, drop us a note at hello@secopsolution.com


.jpg)